Grant funding data for 2023/24
We publish a summary of our grant funding data every year to show how we spend our money.
We update this information every year. The most recent data is for the period from 1 October 2023 to 30 September 2024. You can find further details on our finances in our annual reports.
How many grant applications did we receive?
The number of grants we make and their value varies from year to year, depending on the scale and type of funding programmes we offer, when in the year we open and close funding rounds or when we renew funding for major initiatives.
In 2023/24, we received 2,774 applications for grant funding and made 611 awards worth £1.5bn. This compares to 2,139 applications and 638 awards worth 1.2bn in 2022/23.
We funded research across our four strategic programmes – Discovery Research, Climate and Health, Mental Health and Infectious Disease. We also awarded grants to fund other activities in support of our mission, including public engagement and influencing work. Find out more about the research we fund and current opportunities.
Amount awarded by financial year (£mn)
Where do we fund?
Most of our grants last for several years. As of 30 September 2024, we have 2,671 active grants based at 969 organisations across 104 countries, with a total value of £6.4bn. Of this funding
- 62.3% supports work in the UK
- 23.6% supports work in High Income Countries (HICs), of which 21.7% is awarded directly to HICs
- 14.1% supports work in Lower and Middle Income Countries (LMICs), of which 6.3% is awarded directly to LMICs
Active grant portfolio by adminstering organisation country
An interactive world map that shows Wellcome's active grant portfolio at the end of the financial year 2023/24.
Sorted alphabetically by country
An interactive world map that shows Wellcome's active grant portfolio at the end of the financial year 2023/24.
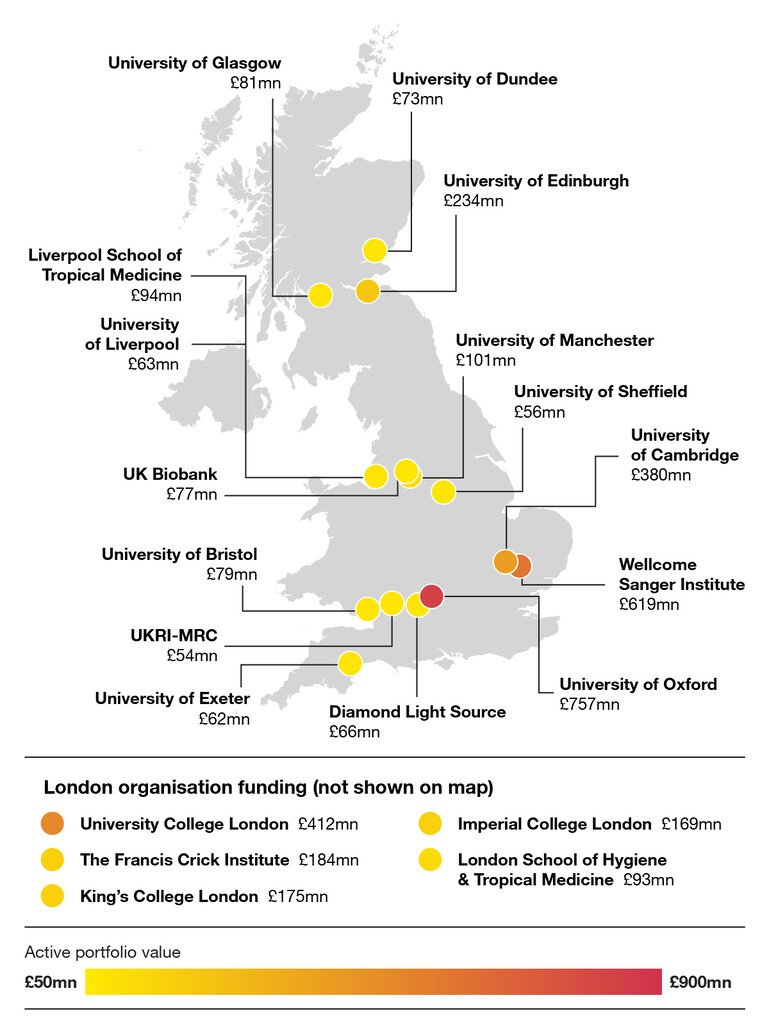
Most of our active funding is administered by institutions in the UK, we have directly funded 2,246 active grants held by researchers across 137 organisations.
UK administering organisations with more than £50mn in active funding

UK map showing the organisations administering the largest sums of active funding to researchers in the UK at the end of the financial year 2023/24
Pages 173-177 of our 2024 annual report set out all organisations administering grants totalling more than £10mn awarded in 2023/24.
Who do we fund?
In 2023/24, 64.3% of grants were made to individuals and 35.7% were made to teams including co-applicants (excluding PhDs and funding given to make research open access).
22.3% of awards made in 2023/24 were to clinically active researchers or research teams where one or more of the grant holders is clinically active.
All the data below relates to the lead applicant or principal investigator for a grant, where the lead applicant provided the relevant data.
Awards in 2023/24
Of lead applicants on grants awarded in 2023/24:
- 53.7% were women
- 5.7% were disabled researchers
- 66.5% were White, 13.7% Asian or Asian British, 10.7% Black or Black British, 5.9% of Mixed ethnicities and 3.1% of Other ethnicities.
- In the UK, 68.2% of awards were to White, 15.0% to Asian or Asian British, 8.3% were to Black or Black British, 5.5% of Mixed ethnicities and 3.0% of Other ethnicities.
Awards by gender and financial year
Awards by ethnicity and financial year
Awards by disability status and financial year
These figures are for lead applicants only, and do not include co-applicants nor staff supported by a grant. Where lead applicants have not provided data, have responded ‘prefer not to say’, or for gender have responded ‘non-binary’ or ‘prefer to self-describe’, they have been excluded from this analysis. Therefore, we report on 89.7% of lead applicants for ethnicity, 90.7% for gender and 89.5% for disability for 23/24. For the ethnicity question we use the UK Census categories and recognise the limitations of this both within the UK and in the global context of our funding.
Success rates in 2023/24 for our competitive grants
Most of our grants are awarded through open competitive schemes or calls. For these we report success rates which is the proportion of total eligible applications for our competitively assessed grants that were successful.
Success rates for 2023/24 were:
- 13.6% for men and 16.6% for women
- Globally, 18.4% for White lead applicants compared to 10.8% for lead applicants from other backgrounds (Black, Asian, Mixed and Other ethnicities)
- In the UK, 21.7% for White lead applicants compared to 15.8% for lead applicants from other backgrounds (Black, Asian, Mixed and Other ethnicities)
- 19.2% for UK-based applicants, 7.8% for applicants from other high income countries and 8.3% for applicants from low and middle income countries
UK and international ethnicity success rates for 2023/24
In 2023/24 Wellcome has increased the proportion of awards given to women, researchers of Black, Asian, Mixed and Other ethnicities and disabled researchers compared to 2022/23.
However, award rates for competitive schemes have been lower for applicants of Black, Asian, Mixed and Other ethnicities than White applicants. We have seen ethnicity award rate gaps both within UK and international applications which we will continue to monitor closely. The overall award rate gap has also been influenced by applicant demographics, where higher proportions of international applicants and applicants of Black, Asian, Mixed, and Other ethnicities have applied to funding calls with on average lower award rates.
Wellcome is taking steps to support underrepresented researchers, for example by launching the Accelerator Awards in 23/24 for Black, Bangladeshi and Pakistani researchers in the UK. This programme funded 27 grants totalling £5.2m in 23/24, with more funding to be granted in 24/25, which aims to put those funded in a stronger position to reach their next career stage.
We continue to consider what more we can do to support successful applications from low and middle-income countries. We have established an LMIC Researcher advisory group to discuss and shape ideas and opportunities. We ran information and advice webinars for potential applicants with live interpretation in Spanish, Portuguese, Vietnamese, Thai, French and Swahili. We are also piloting a number of in-country support and outreach programmes. These programmes were co-developed with researcher leaders in these ecosystems and the support provided is tailored to the needs of local researchers.
Expert advisory panels
We have diversity targets for our external expert panels that assess funding applications.
Of Wellcome’s expert advisory panel members in 2023/24:
- 59% were women (target 50%)
- 32% were from racially minoritised backgrounds (target 25%)
- 31% were from outside the UK (target 50%)
- 60% were early-mid career researchers
- 3.3% were disabled (target 5%)

